
OPEN FROM 9AM TO 5PM – CLOSED ON WEEKENDS

How to Choose the Best Conductivity Meter?

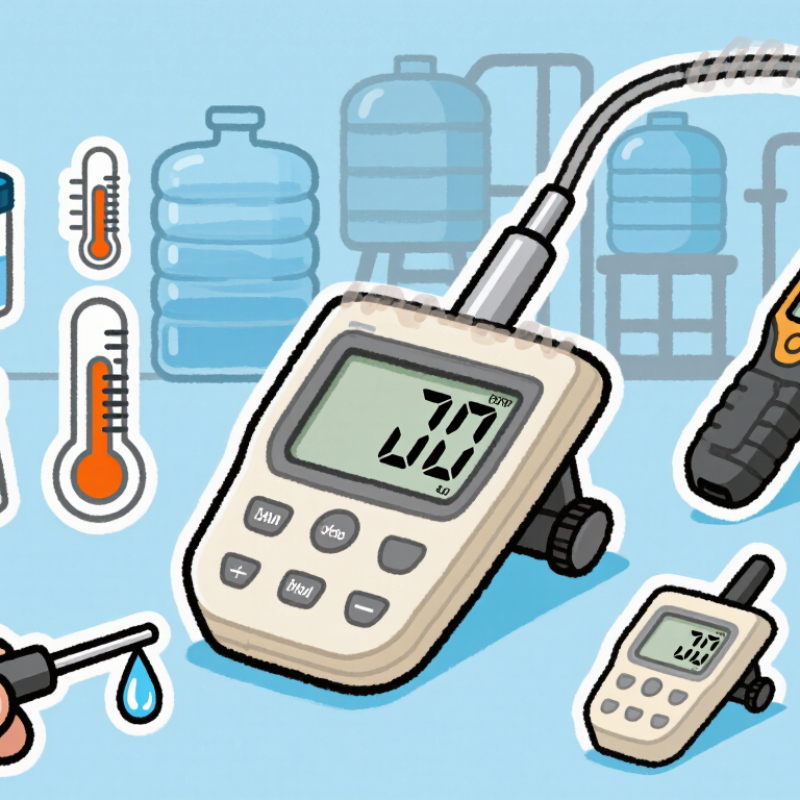
Choosing the right Conductivity Meter can improve water testing, process control, and laboratory decisions. However, the best model is rarely the most expensive one. It must match your sample type, measurement range, accuracy needs, and working environment.

A reliable selection begins with the sample. Pure water requires a sensitive meter with a suitable low-range cell. Salty wastewater may need a wider range and stronger materials. Temperature also changes conductivity, so automatic temperature compensation is valuable during field measurements. Check the sensor’s cell constant, calibration method, display readability, and data-recording options. A meter used beside a production tank should resist splashes and remain easy to clean.

In practical testing, small details matter. A technician may need stable readings after rinsing the probe three times. A laboratory may require traceable calibration standards and documented results. Portable users might value a sealed case more than advanced software. These differences make product comparisons less simple than they appear.

Manufacturers often highlight accuracy first. That is not always enough. Sensor maintenance, sample contamination, and operator technique can affect results just as strongly. I have seen readings drift when air bubbles remained around the probe. Even experienced users can overlook this.

This guide examines the features that influence real performance. It considers accuracy, durability, calibration, temperature compensation, usability, and total ownership cost. The goal is practical judgment, not a perfect checklist. Your application should lead the decision.
How to Choose the Best Conductivity Meter?

Define the Measurement Range: 0.055 µS/cm to 200 mS/cm

How to Choose the Best Conductivity Meter?

Define the Measurement Range: 0.055 µS/cm to 200 mS/cm

Start with the sample, not the instrument’s largest number. The proposed range spans ultrapure water to highly concentrated process liquids. At 25°C, 0.055 µS/cm corresponds to approximately 18.18 MΩ·cm resistivity. This value represents extremely clean water, where carbon dioxide, fingerprints, and poorly rinsed vessels can change results quickly. At the opposite end, 200 mS/cm equals 200,000 µS/cm. Such high conductivity can create polarization, temperature effects, and cell-constant errors.

US EPA Method 120.1 describes conductivity measurement for water and wastewater and emphasizes temperature control and calibration. ASTM D1125 and ISO 7888 also support standardized conductivity testing. These references do not make every meter suitable for the entire range. A practical meter should offer suitable cell constants, automatic or verified temperature compensation, and traceable calibration standards. I have found that a very wide specification can look impressive. It may still perform poorly near the lowest or highest limits.

Tips: List your real sample range first. Leave measurement headroom at both ends. For ultrapure water, use a clean flow cell and stable temperature. For concentrated solutions, confirm the probe material and cell constant. Check whether the stated accuracy applies across the complete range, not only at the midpoint. Report temperature with every result. Small details matter.

Match Accuracy with ASTM D1125 and a ±1% Performance Requirement

Choosing the best conductivity meter starts with the measurement standard, not the screen design. ASTM D1125 covers electrical conductivity and resistivity testing of water. It emphasizes controlled procedures, suitable cells, and reliable temperature conditions. A meter claiming ±1% performance may fit the requirement, but the specification needs careful reading.

Look beyond the headline.

Check whether ±1% means of reading, full scale, or the calibrated range. These values are not interchangeable. Resolution is also different from accuracy. A display showing 0.01 µS/cm does not guarantee trustworthy results. For ASTM D1125 work, select a meter with documented calibration data, stable temperature compensation, and a cell constant appropriate for the sample.

In routine testing, rinse the cell with the sample before recording the result. Use traceable conductivity standards near the expected measurement range. Record sample temperature, stabilization time, and calibration conditions. Small details matter. A dusty cell or trapped air bubble can shift the reading noticeably. Automatic temperature compensation can help, but it may also hide unusual sample behavior.

A ±1% requirement sounds precise. It is not complete by itself. Ask about operating temperature, conductivity range, repeatability, and drift. Review uncertainty data when available. I would not accept a compliance statement without test conditions. That is where many purchasing decisions become weak. A practical choice should match ASTM D1125 procedures, actual sample conditions, and the laboratory’s ability to verify performance regularly.

How to Choose the Best Conductivity Meter? — Match Accuracy with ASTM D1125 and a ±1% Performance Requirement
Measurement Profile Typical Conductivity at 25 °C Suggested Cell Constant Preferred Resolution Required Accuracy Target ASTM D1125 Selection Considerations
Ultrapure and high-purity water 0.055–10 µS/cm Approximately 0.01–0.1 cm−1 0.001 µS/cm or better ±1% of reading Use a low-range cell, stable temperature measurement, and a meter whose stated accuracy applies to the actual low-conductivity range.
Drinking and treated water 50–1,000 µS/cm Approximately 1.0 cm−1 0.1 µS/cm ±1% of reading Confirm that the cell constant, calibration procedure, and temperature-compensation settings cover the expected sample range.
Boiler feedwater and condensate 0.1–10 µS/cm Approximately 0.01–0.1 cm−1 0.01 µS/cm ±1% of reading Temperature effects are significant at low conductivity; select a meter with reliable automatic temperature compensation and a suitable low-conductivity cell.
Cooling water and process water 200–10,000 µS/cm Approximately 1.0 cm−1 1 µS/cm ±1% of reading Choose a model with a range extending above the highest expected value and verify accuracy under the selected temperature-compensation mode.
Wastewater and moderately saline samples 1–20 mS/cm Approximately 1.0–10 cm−1 0.01 mS/cm ±1% of reading Use a higher cell constant when appropriate, prevent fouling on the electrodes, and verify that the meter remains within its accuracy specification in conductive samples.
Brine and high-conductivity samples 20–200 mS/cm Approximately 10 cm−1 0.1 mS/cm ±1% of reading Select a high-range cell and confirm that the instrument specification includes the complete sample range, temperature range, and applicable calibration method.
Accuracy check: For a ±1% requirement, the permitted error is ±0.01 × the reference conductivity. For example, at 1,000 µS/cm, the maximum permitted error is ±10 µS/cm. ASTM D1125 provides test methods for measuring electrical conductivity and resistivity of water; always verify the meter’s published accuracy, cell constant, calibration, and temperature-compensation specifications for the intended range.

Select the Cell Constant: K=0.01, 0.1, 1.0, or 10.0 cm⁻¹

How to Choose the Best Conductivity Meter?

Selecting the correct cell constant is essential for accurate conductivity measurements. The value, written as K, matches the sensor geometry to the sample’s electrical resistance. A K=0.01 cm⁻¹ cell suits very low conductivity water, where tiny ionic changes matter. A K=0.1 cm⁻¹ cell works well for purified water and lightly mineralized samples. K=1.0 cm⁻¹ is the general-purpose choice for drinking water, process water, and moderate salt solutions. A K=10.0 cm⁻¹ cell is designed for high-conductivity liquids, including concentrated chemical or brine solutions.

Match the cell to the expected range.

Using the wrong constant can push readings near the instrument’s limits. The result may look stable but still be inaccurate. Check the manufacturer’s stated measuring range, then select a standard close to the sample’s expected conductivity. Calibration should use a certified solution near that working range, not merely the most convenient bottle. Temperature compensation also matters, because conductivity can change noticeably with temperature.

In routine testing, rinse the cell thoroughly and remove trapped air bubbles. Place the sensor at a consistent depth. I have found that small bubbles can create surprisingly inconsistent readings. A K=1.0 cm⁻¹ cell is often practical, but it is not automatically best. Very pure water may need K=0.01 or 0.1 cm⁻¹, while concentrated solutions may overwhelm it. Recheck the choice when the sample changes, because one cell constant rarely covers every application perfectly.

Standardize Temperature Compensation at the Reference Point of 25°C

How to Choose the Best Conductivity Meter?

Standardize Temperature Compensation at the Reference Point of 25°C

Temperature changes quickly. Conductivity readings can shift significantly as sample temperature rises or falls. A reliable meter should show both the measured temperature and the corrected value. Check whether its compensation settings use 25°C as the reference point. This standard makes results easier to compare across laboratories, production areas, and field inspections.

Choose a meter that allows manual or automatic temperature compensation. Automatic compensation is convenient, but it still needs verification. Place the probe and a certified conductivity standard in the same solution. Allow the temperature to stabilize before calibration. Confirm that the displayed temperature matches an independent thermometer. Then check whether the meter reports the expected conductivity at 25°C.

Small errors matter. A sample at 30°C may appear more conductive than the same sample at 25°C. Without consistent compensation, operators may mistake temperature effects for process changes. Record the actual sample temperature, reference temperature, compensation mode, and calibration date. Keep the probe clean, because residue can distort both conductivity and temperature readings. Do not assume the factory setting is correct for every application. A practical mistake is treating “automatic” as “accurate.” I have seen users skip stabilization and blame the instrument for unstable results. Review the settings before each critical measurement, especially when samples move between rooms or outdoor locations.

Verify Calibration with 84, 1,413, and 12,880 µS/cm Standards

How to Choose the Best Conductivity Meter?

A reliable conductivity meter should prove its accuracy across the range you actually measure. Verification with 84, 1,413, and 12,880 µS/cm standards provides three useful checkpoints.

The low standard challenges sensitivity in purified or lightly mineralized water.

The middle standard reflects many routine laboratory and process samples.

The high standard tests performance in concentrated solutions.

Use fresh, certified standards with documented traceability. Check their expiration dates and storage conditions before calibration. Rinse the probe with deionized water, then rinse it again with a small portion of the standard.

Small details matter. Avoid transferring liquid between containers. Hold the sensor at the recommended depth, remove trapped bubbles, and wait for a stable reading.

Temperature also matters because conductivity changes noticeably with temperature. Confirm whether automatic temperature compensation matches your testing method.

After calibration, measure each standard as an independent verification rather than assuming the meter is correct. Record the displayed value, temperature, standard lot, and acceptance limits.

A result drifting outside tolerance may indicate contamination, aging electrodes, poor cell placement, or an unsuitable cell constant. That assumption fails. A quick calibration can look successful while missing high-range error.

In practice, the three-point check is more informative than testing only one convenient standard. Still, it is not perfect; standards can degrade, and even careful operators can overlook a dirty probe. Regular verification exposes those weaknesses before they affect reported results.

Amet mattis vulputate enim nulla aliquet. Id porta nibh venenatis cras sed felis dictumst vestibulum rhoncus est.
This error message is only visible to WordPress admins

Error: No feed found.

Please go to the Instagram Feed settings page to create a feed.

Quick links